Best Analytics Tools for Streamers in 2026: Track What Actually Grows a Channel
StreamerPerks earns a commission from some outbound links. How programs are checked and how the site is funded.
Best Analytical Tools for Streamers in 2026
Streaming without data is the most expensive mistake a streamer can make. You can stream 40 hours a week, post daily on every platform, and still plateau, because without numbers you're guessing about what works, what doesn't, and where the growth actually is.
Analytics tools replace that guessing with a plan. They tell you when to stream, what to play, which audiences to target, and how you compare with other channels. Streamer analytics have matured a lot by 2026: you can get anything from basic channel stats to AI-driven audience insights and cross-platform data.
This guide covers the best analytics tools for streamers in 2026. Most of it is about Streams Charts, the most complete livestreaming analytics platform, but it also looks at StreamMetrix, TikTokStats, and DoHuya.
Why do analytics matter for streamers?
Analytics show you when to stream, what to stream, and whether your channel is actually growing:
- Schedule: the data shows when your own audience is online, which is often not what a generic guide tells you.
- Game and category choice: look for "low competition, high viewership" categories so more people find you.
- Growth tracking: find out whether the channel is really growing or just bouncing around inside a plateau.
- Sponsorships: brands want data, and professional analytics in a media kit can raise your sponsorship rates considerably.
- Competitor research: see what works for streamers in your niche and borrow what fits.
- Content ROI: work out which streams, clips, and formats bring the most engagement per hour you put in.
Streams Charts: the industry standard for livestreaming analytics
Streams Charts is the world's largest database of livestreaming statistics. It has tracked data for over 59 million channels across Twitch, YouTube, Kick, TikTok Live, NimoTV, and more since 2019. If you take data seriously, this is the platform the others get measured against.
What makes Streams Charts different
Most analytics tools show you your own data: followers gained, average viewers, stream duration. Streams Charts does that too, but it also gives you market data. You can look across the whole livestreaming market, spot trends before they peak, and compare your numbers with millions of other channels.
It's the difference between checking your bank balance and reading a full market research report on your industry.
Core features
1. Cross-platform analytics
Streams Charts tracks the major livestreaming platforms in one dashboard:
| Platform | Data Available |
|---|---|
| Twitch | Full channel, game, category, and chat analytics |
| YouTube Live | Channel and stream performance, audience data |
| Kick | Channel analytics, game rankings, chat data |
| TikTok Live | Viewer metrics, category performance |
| NimoTV | Regional performance data |
| CHZZK (Naver) | Korean streaming market analytics |
If you simulcast or are thinking about switching platforms, this cross-platform view matters a lot.
2. Channel and stream deep dives
For any channel in the database, Streams Charts shows:
- Hours watched (total and trending)
- Average and peak concurrent viewers
- Follower and subscriber growth
- Stream history with per-session performance
- Game and category breakdown by viewership
- Chat activity metrics
- Audience retention rates
- Language and regional distribution
3. Game and category data
For streamers chasing growth, this is one of the most useful parts of Streams Charts:
- Top games by peak viewers and peak channels
- Game trend tracking over custom time periods
- Upcoming game releases with projected interest
- Category saturation metrics, which help you find games with high viewership but relatively few streamers
Practical use case: before you pick a game, check Streams Charts for titles with a high viewer-to-streamer ratio. A game with 50,000 viewers and 200 streamers gives you far more discoverability than one with 100,000 viewers and 10,000 streamers.
4. Audience demographics and insights
- Geographic distribution (country-level breakdown)
- Language preferences
- Viewing patterns (peak activity times by region)
- Cross-platform audience overlap
This is exactly the demographic data brands look for in a media kit.
5. Content creation and reporting tools
- Recap Generator creates visual recaps of your streaming performance to share on social media.
- Sponsor Banner generates branded sponsor banners using your analytics data.
- Mail Reports sends scheduled email reports with your key metrics.
- Live Rankings shows real-time leaderboards during streams.
Pricing plans
| Plan | Price | Best For | Key Features |
|---|---|---|---|
| Free | $0 | Casual exploration | Basic platform statistics, limited channel views |
| Streamer | From $9/month | Individual content creators | Analytics for your own channels, custom time filters |
| Agency/Pro | Custom | Agencies, esports orgs | Bulk data, API access, white-label options |
Who should use Streams Charts?
- Growth-focused streamers looking for underserved games and the best times to stream.
- Multi-platform creators who want one dashboard for everything.
- Streamers chasing sponsorships who need professional analytics to show brands.
- Esports organizations tracking tournament viewership and how competitors perform.
StreamMetrix: performance analytics for serious streamers
StreamMetrix is built around performance analytics and content optimization. It's for streamers who want to see how their streaming decisions connect to their growth.
Core features
- Session-level tracking that compares each stream with your historical average.
- Viewer flow analysis showing when viewers join, peak, and leave during a stream.
- Clip correlation that ties specific in-stream moments to viewer spikes.
- Chat sentiment analysis to measure audience mood and engagement quality.
- Growth velocity tracking, which looks at the rate of change over time as well as raw followers gained.
Best for
Streamers who want better individual streams rather than better market positioning. Streams Charts answers "what should I stream?" StreamMetrix answers "how do I stream better?"
TikTokStats: short-form video analytics for multi-platform creators
TikTok Live and short-form clips now matter more for streamer growth, so dedicated analytics tools for them have appeared.
Core features
- TikTok LIVE analytics: viewership trends, gift tracking, and audience retention for live streams.
- Short-form performance: compare your TikTok videos with category averages.
- Hashtag analytics: spot trending hashtags in your niche before they peak.
- Competitor benchmarking: see how your TikTok growth rate compares with similar accounts.
- A posting time calculator based on when your audience is actually active.
Why it matters
Plenty of streamers use TikTok for discovery, posting highlights, setup tours, and tips to drive traffic back to their main platform. If that's you, you need to understand TikTok's own metrics.
DoHuya: Asian streaming market data
DoHuya covers the Asian streaming market, mainly Chinese platforms like Douyu, Huya, and bilibili, plus Korean platforms (CHZZK) and newer Southeast Asian markets.
Core features
- Coverage of several Asian platforms: Douyu, Huya, bilibili, CHZZK, Nimo TV, and more.
- Cross-regional audience analysis, so you can follow Asian streaming trends before they reach Western platforms.
- Game performance tracking with real-time data on what's trending in Asian gaming markets.
- Dashboards in English, Chinese, Korean, and Japanese.
Why it matters
Western streaming trends often show up in Asia 6-18 months earlier. If you track Asian market data, you can catch rising games, formats, and monetization ideas before Western markets get crowded with them.
Comparing the tools: which one is right for you?
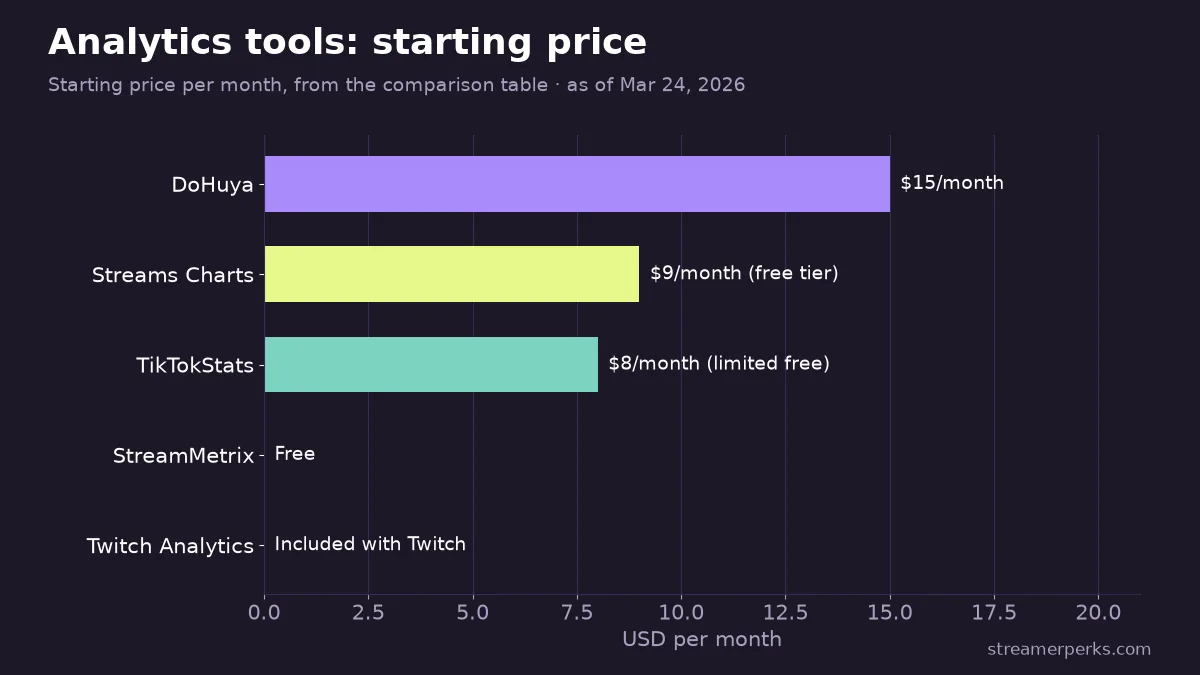
| Tool | Best For | Free Tier | Starting Price |
|---|---|---|---|
| Streams Charts | Cross-platform market intelligence, growth strategy | Yes | $9/month |
| StreamMetrix | Individual stream performance optimization | Free | Free |
| TikTokStats | Multi-platform creators focused on short-form | Limited | $8/month |
| DoHuya | Asian market intelligence, trend forecasting | Limited | $15/month |
| Twitch Analytics (native) | Basic Twitch channel metrics | Free (Twitch) | Included |
Which analytics tools should you use at each stage?
Just starting out
Use: Twitch/YouTube native analytics + Streams Charts (Free)
Built-in platform analytics tell you what's happening on your channel. The Streams Charts free tier shows which games are trending and how you compare with the market. The combination costs nothing and covers 80% of what you need.
Growing creator (100-1,000 viewers)
Use: Streams Charts (Streamer plan) + StreamMetrix
Now you have enough data to optimize. Streams Charts helps you pick the right game and time slot, and StreamMetrix helps you improve once you're live.
Established streamer (1,000+ viewers)
Use: Full stack: Streams Charts + StreamMetrix + TikTokStats (if active on TikTok)
With a bigger audience, each small gain in retention or viewer acquisition adds up fast.
Multi-platform creator
Use: Streams Charts (for cross-platform intelligence) + platform-native analytics + TikTokStats
The Streams Charts cross-platform dashboard is the quickest way to watch several streams at once.
Making analytics actionable: a framework
The weekly analytics review (30 minutes)
- Check your channel trend (5 minutes). Is average viewership up, down, or flat compared with last week?
- Review your best streams (5 minutes). Which game, time, and day did best?
- Check the market on Streams Charts (10 minutes). Which games are rising? Any upcoming releases worth streaming?
- Plan next week's schedule (10 minutes). Put what you found into next week's stream plan.
The monthly deep dive (2 hours)
- Month-over-month growth: are you growing fast enough to hit your 6-month goal?
- Content audit: which stream types (gameplay, IRL, co-stream, tournament) perform best?
- Competitor check: how do your numbers compare with streamers at your level?
- Monetization review: which affiliate products brought in the most revenue?
Conclusion
The best streamers in 2026 run their channels like businesses. They make decisions from data, review performance regularly, and have a clear growth plan.
Start with the free tools, learn what the numbers tell you, and pay for more advanced ones as the channel grows. Streams Charts gives you the market data to position your channel. StreamMetrix helps you stream better once you're live. TikTokStats and DoHuya cover trends and audiences most streamers ignore.
Streamers don't plateau because they stream too little. They plateau because they stream without direction. Pick your tools, set up a weekly review, and use what the data shows you.
Related guides
- The Comprehensive 2026 VTuber Setup Guide: Best Trackers, Software, and Commissions
- The Best Audio Mixers and XLR Interfaces for Streamers in 2026
- The Ultimate Comparison of Custom Merch Platforms for Streamers in 2026
- Streamer Taxes 2026: LLC, Write-Offs and IRS Forms
- Best Streaming Software Compared (2026): OBS vs StreamElements vs Streamlabs vs XSplit